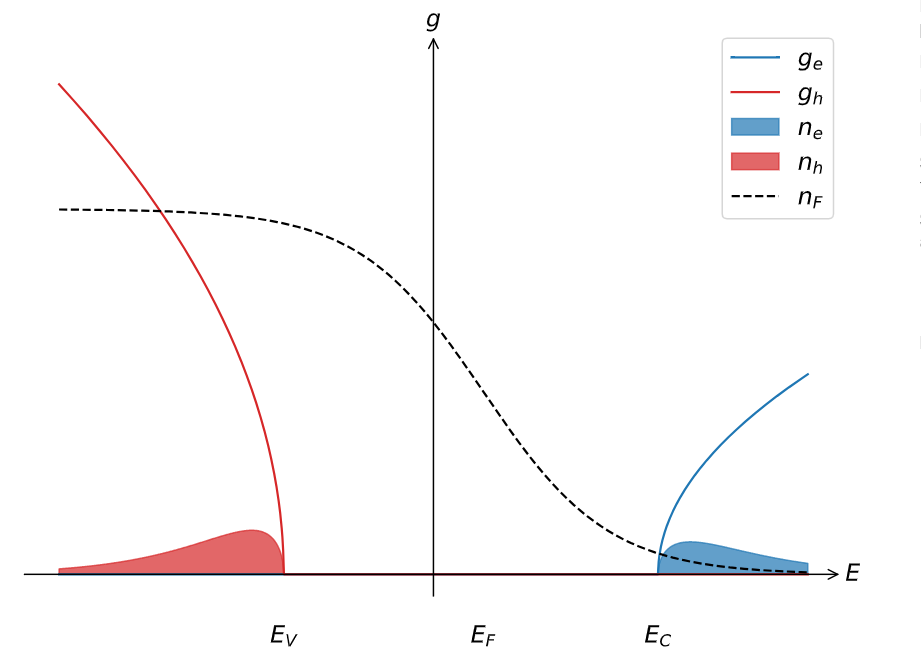
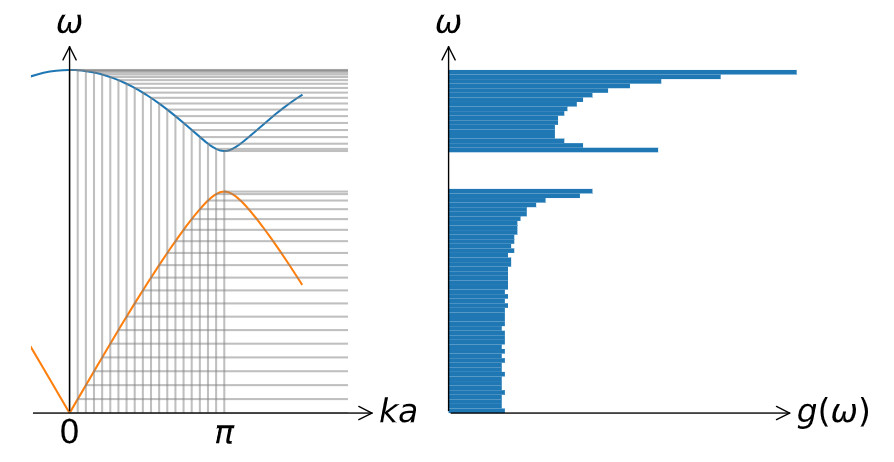
The top density of states is for a 3D system, the bottom one is for a 1D system. It makes a big difference, check out the lecture notes here: Sommerfeld model - Open Solid State Notes.
Thank you! So the trick with drawing the density of states from the dispersion only works in 1D then I imagine?
Indeed. The same conceptual idea would apply in higher dimensions (sampling every point in the higher dimensional k-space and making a histogram), but sketching using a plot of a 1D dispersion doesn’t.