Hi everyone!
Density of states g(E) is an important concept, as much as it is confusing. We need to both form an intuitive picture, and keep track of the math.
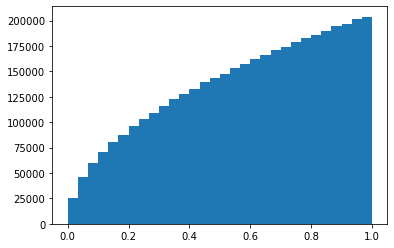
I realized that another way to obtain our results, as well as gain an intuitive understanding, is using a numerical approach. Instead of going through the integration, we can take a discrete grid of k-values, compute the energies of all these levels, and plot a histogram.
Here’s a preview of how the calculation looks for 3D electrons:
energies = (
    momenta.reshape([-1, 1, 1])**2
    + momenta.reshape([1, -1, 1])**2
    + momenta.reshape([1, 1, -1])**2
).flatten()

pyplot.hist(energies, bins=30, range=(0, k_max**2));
And here is the complete notebook—check it out.