In Ex2.4 and 2.5 of band structures in 2D. Does anybody understand how these shapes were derived?
Where does the rectangle come from and why is it rotated? Why does it change to an elliptical shape for less filled bands?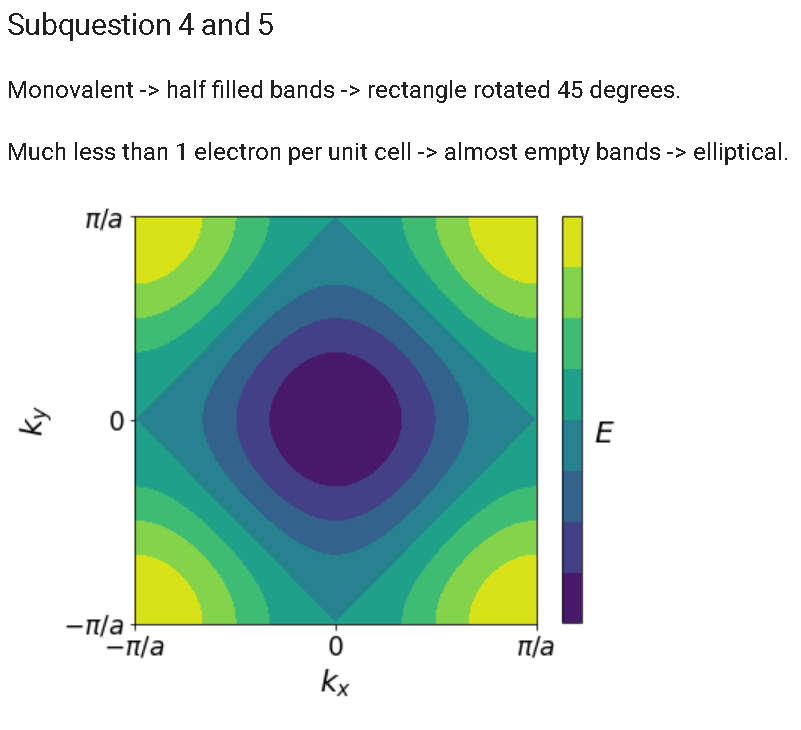
So if you look at your result from part 3, there is a figure in the lecture notes that plots that exact dispersion relation:
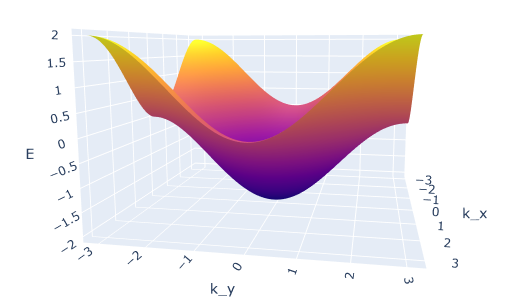
You know that the atoms are monovalent and that the max number of electrons per energy band is 2, so the energy bands are half filled. The answer plot is a top down view (which I think is kind of hard to visualize), but essentially if you look at the ‘3D’ graph, and trace out the halfway points on the energy curve you get:
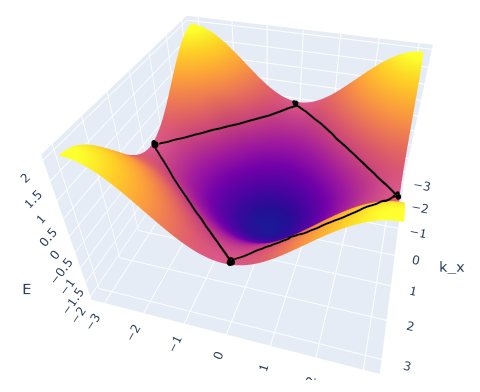
which is the rectangle they’re talking about. If you decrease the number of electrons per band the amount the energy band is filled decreases which traces out an elliptical shape.