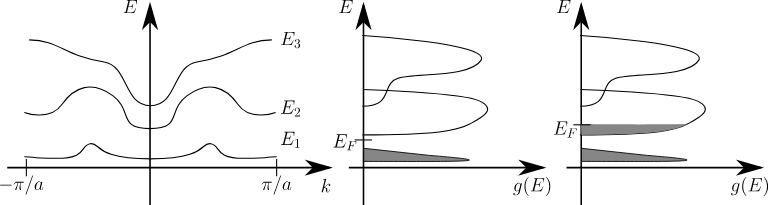
Hi! I was wondering why the density of states in the notes of lecture 12 seems to be shown differently from how I would expect it to look. Why does it not go up at the energies where E1/E2/E3 have maxima/minima (not sure how to call it, but I mean for example E3 at k=0)?
Hi Lucienne!
I am assuming you refer to this sketch:
Have a look at the derivation of the density of state for a parabolic dispersion in the Sommerfeld model lecture notes:
The DOS as a function of energy: g(E) is proportional to the inverse of the dispersion relation derivative: \left(\frac{\mathrm{d}E}{\mathrm{d}k}\right)^{-1}, so intuitively, DOS is high where the dispersion relation is flat and DOS is low where E(k) changes rapidly.
It is however tricky to visualise the points where \left(\frac{\mathrm{d}E}{\mathrm{d}k}\right) \approx 0, and the inverse of the derivative is infinite. In that case, think of rapidly changing DOS, a steep slope or a peak.
Let me know if that helps you out ![]()
Does anyone know any other way of intuitively/formally visualizing DOS from the dispersion relation?
Thanks for your response:) I do understand how it works (I believe), but the picture does not really show that, right? The DOS does not have peaks where (\frac{dE}{dk})^{-1}\approx 0, looking at e.g. the energies at which E3 has (\frac{dE}{dk})^{-1}\approx 0.
Perhaps this paragraph from the Sommerfeld model lecture note will be helpful to get the intuition why DOS in a system with electrons is rather strictly finite even when the inverse of the dispersion relation derivative: \left(\frac{\mathrm{d} E}{\mathrm{~d} k}\right)^{-1} indicates that it would be infinite.
Do these two figures give you an intuition?
and
you are right, this is a handmade sketch of the density of states that is not very accurate. It should more precisely reflect where are the peaks given where the dispersion is flat and the fact that we are in 1D. Thanks for the notice - we will update this!
Aah okay great, then I can sleep in peace. Thank you both!![]()
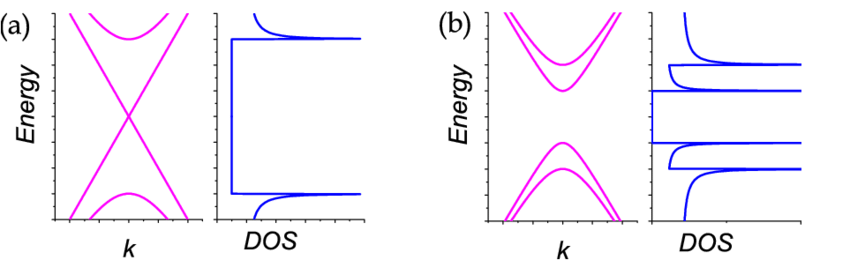
So I made an attempt at making a clearer sketch:
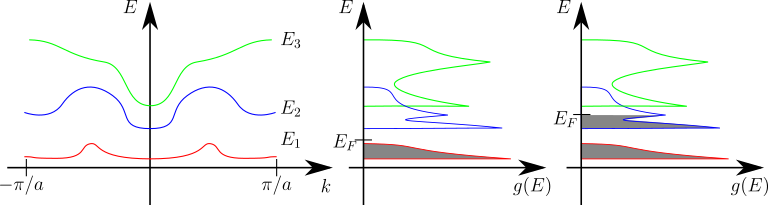
Does this make more sense, @t.vandersar, or shall we replace the drawing entirely?
yes looks good, thanks for the suggestion!