Density of states in higher dimensions

Hello,

I have a question regarding the density of states in higher dimensions. If we have to graph the density, a useful way was showed in lecture ‘many atoms per unit cell’.


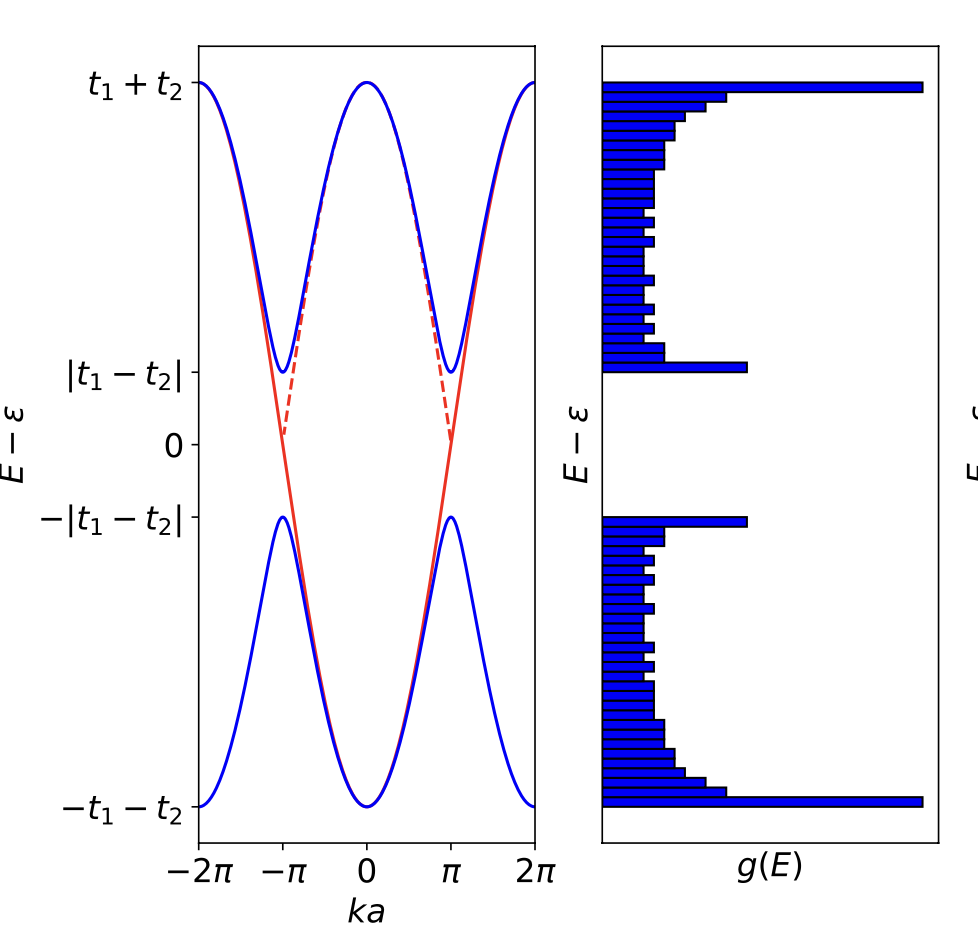
However, if I use this method to draw the density of states for for example free electron dispersion, I end up with g(E) ~ 1/sqrt(E). Does this mean that this way of graphing only works for 1D systems? Why is this the case? And is there a way to graph the density of states in this way for higher dimensions? And then how can I determine the relationship between density of states and E for higher dimensions?

Thank you in advance.

Indeed, in 1D it is particular straightforward to graphically construct the density of states from the dispersion. Perhaps you saw this already, but in the graph you show above, you can see the 1/sqrt(E) divergence close to the band minima and maxima.

In 2D the procedure is in principle the same: if you make a graph of E vs kx and ky.using e.g. python and then histogram the energy values, you will get the DOS. (just try doing so for a parabolic dispersion to confirm the DOS is constant). However, graphically constructing the DOS for more than 1D on paper is more challenging.